During my time in downtown Brooklyn, one of the things that drove me mad was looking at restaurant reviews. Friends and I would decide to go to restaurants, and we’d look at the ratings. When we did, we’d get an aggregate rating of 3.5 or 4. But what does it all mean? It really doesn’t mean anything unless we understand the distribution of the data.
It drove me nuts. I had to find out the average, and what the review landscape look like.
So I did. I cobbled together a program in Python using Scrapy, Pandas, and Matplotlib. I would have left out Sir Scrapy, but the review website’s api had this random feature where if you queried a restaurant for all its reviews, it would give you 3. Grr…
Process:
I used the a certain restaurant review website’s own filters to hone in on downtown Brooklyn within a mile radius. The website’s api request gave me two two longitude latitude pairs. They are shown below:
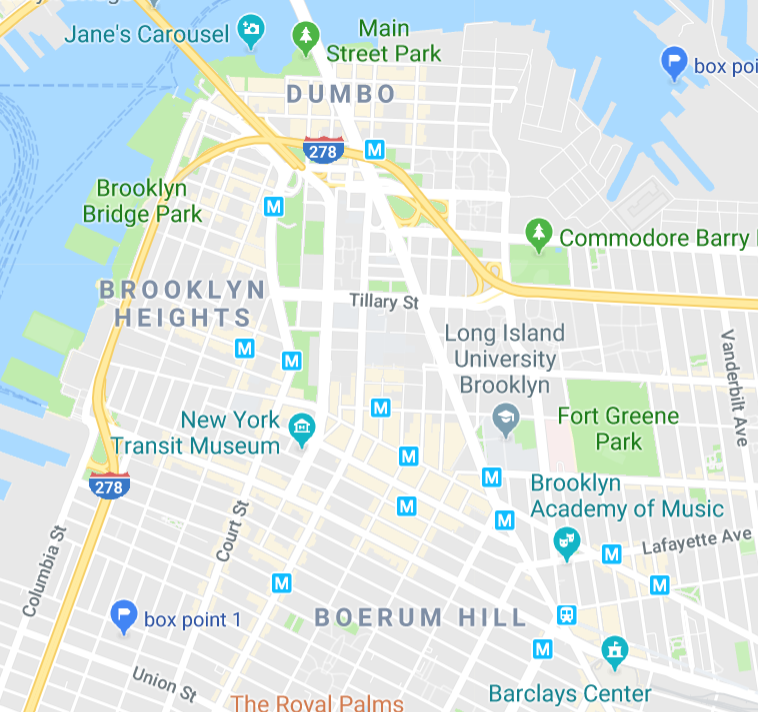
Interesting. So it’s either endpoints of a circle, or a rectangle. I think it’s a rectangle, so we’re going to refer to this area as the rectangle.
This search query gave me a starting point of all restaurants, but displayed only 10 or 20. I scraped them, and then used a program to move to the next page. I stored the set of restaurants in a directory. Then for every restaurant, I automated a http request, got to the main webpage which was an anchor point of a restaurants set of reviews. So I went through all those reviews and got them too.
Results:
Number of restaurants in the bounding box: ~500.
Number of restaurant reviews: ~70,000.
The average of all review ratings: 3.70
Standard deviation of all ratings: 1.32
Graphs:
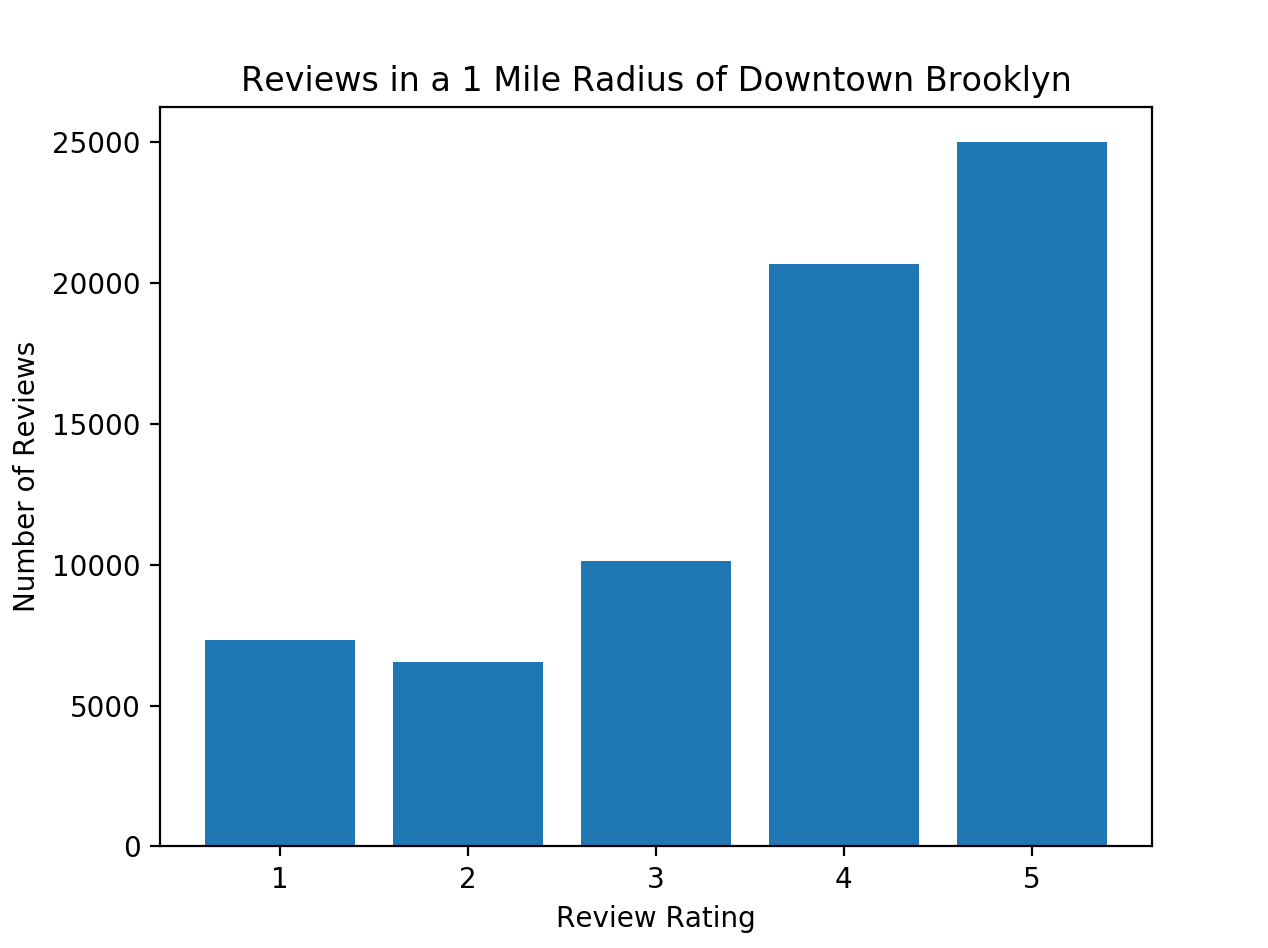
So people in Brooklyn tend to rate 4s and 5s much more often than 1s and 2s. I wonder if you do this for every city, then could you gauge a friendliness metric for every city, and see if it correlates with the happiness ranking of every country? That would be AMAZING.
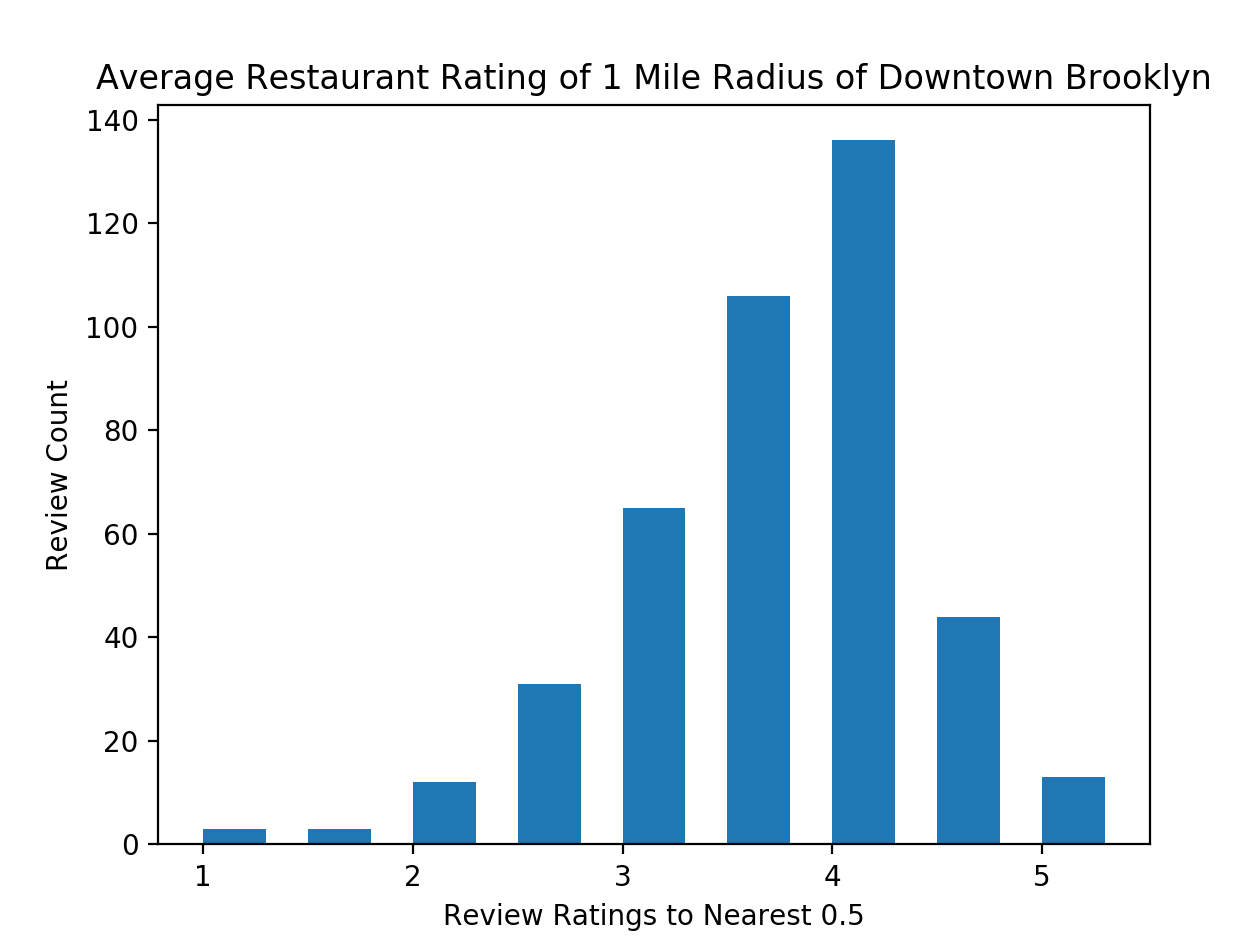
This is if you plot average rating of restaurants, and plot them by rounding them to the nearest 0.5.
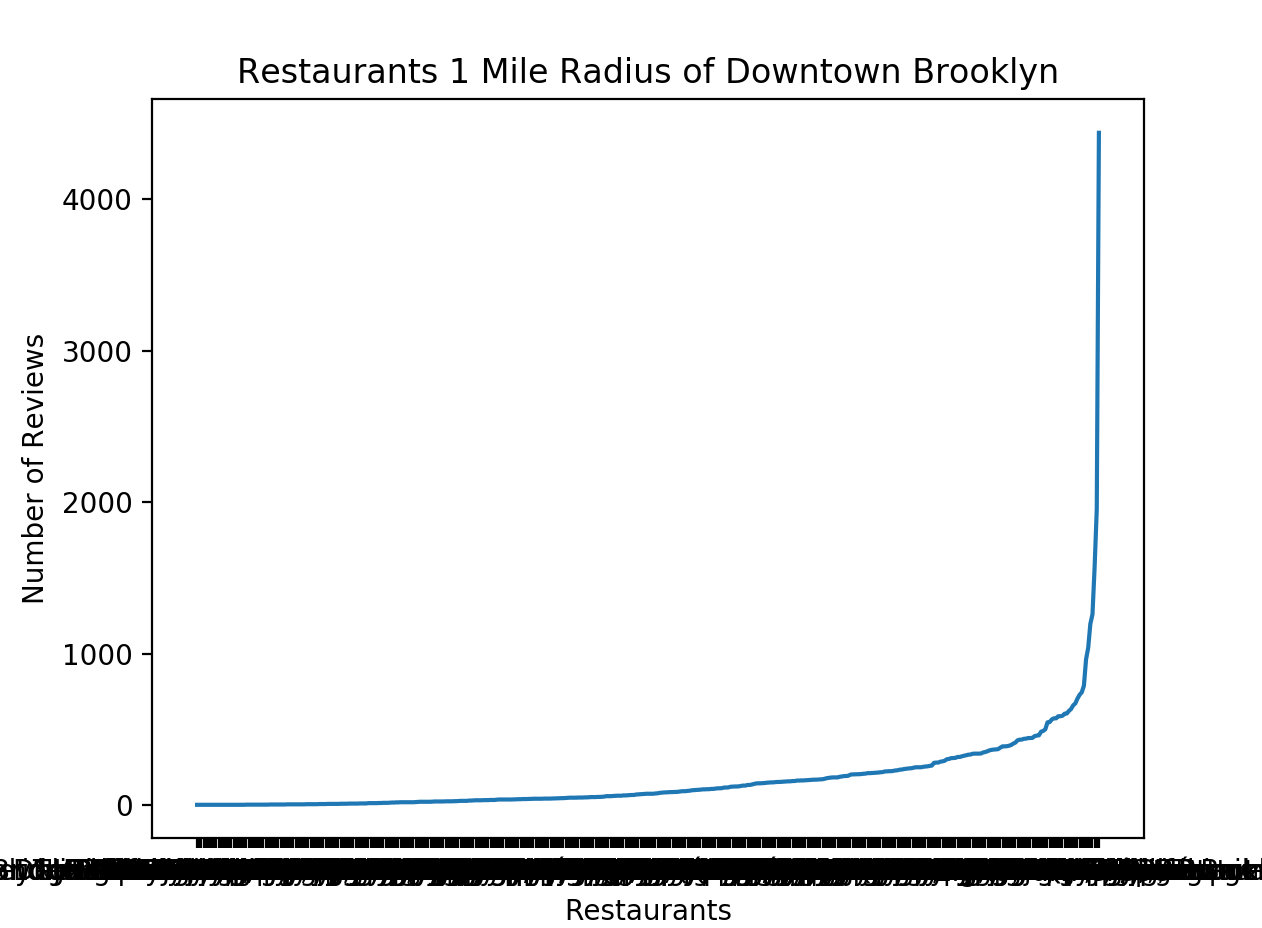
This is simply the number of reviews and their restaurant names. Seems like it follows some power law distribution, but I’m not quite sure. It may be just one outlier.
Top 20 restaurants by review count:
I guess this can be interpreted as popularity or to some degree how much people care. One can perhaps use this information to extrapolate the length of time the restaurants have been around.
| Restaurant | Number of Reviews |
| Grimaldi’s Pizzeria | 4440 |
| Juliana’s Pizza | 1955 |
| Junior’s Restaurant | 1573 |
| Joya | 1259 |
| Rocco’s Tacos & Tequila Bar | 1196 |
| The River Café | 1038 |
| Habana Outpost | 962 |
| Shake Shack | 788 |
| Mile End Delicatessen Brooklyn | 744 |
| Clover Club | 728 |
| Yaso Tangbao | 703 |
| Ki Sushi | 671 |
| Hanco’s | 658 |
| Vinegar Hill House | 634 |
| Alamo Drafthouse Cinema Downtown Brooklyn | 621 |
| Forno Rosso | 604 |
| Two 8 Two Bar & Burger | 603 |
| Dekalb Market Hall | 589 |
| Bedouin Tent | 586 |
| Sottocasa Pizzeria | 586 |
Top 50 Highest Restaurants by review average (ignore just 5s – probably insufficient number of reviews. Perhaps I will add review count next to the rating later…)
| Restaurant | Average Rating |
| Moshman Dental | 5 |
| Pipitone’s Pizza | 5 |
| Bird’s Eye Vietnamese | 5 |
| VALENTINE’S CAFE | 5 |
| First Wok | 5 |
| New Fresco Tortilla Plus | 5 |
| Smith Gourmet Deli | 4.952380952 |
| Thai on Wheels | 4.888888889 |
| Lillo Cucina Italiana | 4.870588235 |
| GMC Temaxcal Deli & Grocery | 4.833333333 |
| Simple NYC-Downtown Brooklyn | 4.80952381 |
| Yumpling Food Truck | 4.790697674 |
| Cafe Gitane | 4.75 |
| Sunny Delicatessen | 4.75 |
| Pret A Manger | 4.666666667 |
| Ashland | 4.625 |
| Govinda’s Vegetarian | 4.621118012 |
| Dariush Persian Cuisine | 4.580645161 |
| Grand Canyon Restaurant | 4.577777778 |
| dot & line | 4.52173913 |
| Rice & Miso | 4.519230769 |
| dumboLUV | 4.5 |
| Kazi Halal | 4.5 |
| Saint Julivert | 4.5 |
| Yemen Cafe & Restaurant | 4.452173913 |
| E-bite | 4.444444444 |
| Sanpanino | 4.444444444 |
| ACE Thai Kitchen | 4.414634146 |
| Sushi Gallery | 4.4140625 |
| Bread & Spread | 4.412698413 |
| Lavatera Grill | 4.409090909 |
| Forcella Fried Pizza | 4.407407407 |
| Chicks Isan | 4.404761905 |
| Doner Kebab NYC | 4.401360544 |
| Mr. Fulton | 4.4 |
| W XYZ Bar | 4.4 |
| Yossi’s Cart | 4.4 |
| Juliana’s Pizza | 4.396930946 |
| Shawarma & Grill | 4.375 |
| Makina Cafe | 4.375 |
| Koji Izakaya | 4.358974359 |
| Daigo Handroll Bar | 4.333333333 |
| Metro Buffet | 4.333333333 |
| Warung Roadside | 4.333333333 |
| Taiki | 4.327586207 |
| Sultan Restaurant & Cafe Lounge | 4.3125 |
| Espresso Me | 4.306122449 |
| Piz-zetta | 4.305220884 |
| Downtown Natural Market | 4.304347826 |
| Sottocasa Pizzeria | 4.298634812 |
To-do list:
- I need to ask someone who is really knowledgable in statistics, or do research on if there’s a law that correlates the number of reviews to its true rating. What should it converge on? For example, a review with 1000 reviews with a 3.5 should be weighted differently with a review with 10 reviews with a 3.5.
- It would be interesting to plot the average words per review or aggregate words per restaurant.
- What would be the most commonly used and the most least commonly used words? I want to run it through a basic NLP program to stem the word, remove stop words, etc.
- What if we have a list of words, give them a raw numerical value of positive and negative numbers, and average that out. Would the rankings be different?
- What if you plot out the datestamps of the reviews, and use some metric for happiness/economic activity, and see if there’s a correlation between that and the stock market or the consumer sentiment index? Would there be a correlation?
- See what another review service from a search engine’s data looks like.
Examining all this data is a lot of fun! But for now, my experiments are on hiatus. There’s already enough things to read and build! But if anyone wants some Brooklyn data, let me know!
Tips:
- You should probably use this dataset to get interesting insights: https://www.yelp.com/dataset/download
- DO NOT SIMPLY SCRAPE ON YOUR LOCAL NETWORK. If you mess up, it’ll cause your ip to be banned. Your ISP will refresh your ip within a month, but it’ll annoy the people who share the internet connection with you. Either use a vpn, or spin up a cloud computing instance and use that to download your data.
- Rate limit your scraper. Don’t try to download all this data within a span of a minute. Pace your scraper to download a reasonable amount in a minute so you don’t overload their apis. Or get caught. There is no need to rush.
- You should learn regular expressions. I was talking to someone who was doing data collecting with DOM traversal. That maybe more painful than building a reasonable regular expression. My two cents.